2016: A Year in Review

Every year brings its share of surprises. But how many of us could have imagined that 2016 would see the Chicago Cubs win the World Series, Bob Dylan receive the Nobel Prize in Literature, Donald Trump elected president, and the Dow Jones Industrial Average close out the year a whisker away from 20,000?

The answer is very few—a lesson that investors would be wise to remember.

At year-end 2015, financial optimists seemed in short supply. Not one of the nine investment strategists participating in the January 2016 Barron’s Roundtable expected an above-average year for stocks. Six expected US market returns to be flat or negative, while the remaining three predicted returns in single digits at best. Prospects for global markets appeared no better, according to this group, and two panelists were sufficiently gloomy to recommend shorting exchange-traded emerging markets index funds.1

Results in early January 2016 appeared to confirm the pessimists’ viewpoint as markets fell sharply around the world; the S&P 500 Index fell 8% over the first 10 trading sessions alone. The 8.25% loss for the Dow Jones Industrial Average over this period was the biggest such drop throughout the 120-year history of that index.2 For fans of the so-called January Indicator, the outlook was grim.

Then things seemingly got worse.

Oil prices fell sharply. Worries about an economic debacle in China re-entered the news cycle. Stock markets in France, Japan, and the UK registered losses of more than 20% from their previous peaks, one customary measure of a bear market.3 Plunging share prices for leading banks had many observers worried that another financial crisis was brewing. As US stock prices fell for a fifth consecutive day on February 11, shares of the five largest US banks slumped nearly 5%, down 23% for 2016.

The Wall Street Journal reported the following day that “bank stocks led an intensifying rout in financial markets.”4 A USA Today journalist observed that “The persistent pounding global stock markets are taking seems to be taking on a more sinister tone and more dangerous phase, with emotions and fear taking on a bigger role in the rout, investors questioning the ability of the world’s central bankers to calm the market’s frayed nerves, and a volatile environment in which selling begets more selling.”5

February 11 marked the low for the year for the US stock market. While prices eventually recovered, as late as June 28 the S&P 500 was still showing a loss for the year. Meanwhile, a number of well-regarded professional investors argued that the next downturn was fast approaching. One prominent activist in May predicted a “day of reckoning” for the US stock market, while another reportedly urged his fellow hedge fund managers at a conference to “get out of the stock market.” A third disclosed in August a doubling of his bearish bet on the S&P 500.6

Throughout the year, some observers fretted over the pace of the economic recovery. The New York Times reported in July that “Weighed down by anemic business spending, overstocked factories and warehouses, and a surprisingly weak housing sector, the American economy barely improved this spring after its usual winter doldrums.”7

Despite all of this noise, the S&P 500 returned 11.9% for the year and international stocks8 returned 4.4% for US dollar investors (6.9% in local currency9), helping to illustrate just how difficult it is to outguess market prices. Once again, a simple strategy of embracing sensible asset allocation and broad diversification was likely less frustrating than fretting over portfolio changes in response to news events.

We believe it’s as important today as it was 10 years ago to base your portfolio allocation structure on two broad concepts: 1st, your risk tolerance, and 2nd, what financial goals your portfolio will be used for. We help our clients develop their financial goals and then build and monitor a portfolio that marries these goals with their appetite for risk. And we’d love to help you too. Get in touch today.


1. Lauren Rublin, “Peering into the Future,” Barron’s, January, 25, 2016.
2. www.djaverages.com, accessed January 6, 2017.
3. Michael Mackenzie, Robin Wigglesworth, and Leo Lewis, “Stock Exchanges across the World Plunge into Bear Market Territory,” Financial Times, January 21, 2016.
4. Tommy Stubbington and Margot Patrick, “Banks Drop as Global Rout Deepens,” Wall Street Journal, February 12, 2016.
5. Adam Shell, “Market Tumult Charts New Waters,” USA Today, February 12, 2016.
6. Dan McCrum and Nicole Bullock, “Growling Bears Provide Soundtrack for Investors,” Financial Times, May 21, 2016.
7. Nelson D. Schwartz, “US Economy Stays Stuck in Low Gear,” New York Times, July 29, 2016.
8. Source: MSCI. International stocks represented by the MSCI All Country World ex US IMI (net div.).
9. Local currency return calculation represents the price appreciation or depreciation of index constituents and does not account for the performance of currencies relative to a base currency such as the US Dollar. Local currency return is theoretical and cannot be replicated in the real world.
10. Article written by Weston Wellington with edits by Coastal Wealth Advisors, LLC.

Negative Interest Rates

Nominal interest rates are currently below zero in many countries, including Germany, Denmark, Switzerland, Sweden, and Japan. With new acronyms like ZIRP (Zero Interest Rate Policy) and NIRP (Negative Interest Rates Policy), these levels have turned the common belief that zero is the lower bound for such rates on its head. While negative interest rates are a relatively new phenomenon, periods of widespread negative real returns across countries have been quite common.

WHAT ARE AND WHY CARE ABOUT REAL RATES OF RETURN?

In 1970, a loaf of bread cost 25 cents. A gallon of gas cost 36 cents. Today, an average loaf of bread and a gallon of gas each cost around two dollars.When the prices of goods and services increase, consumers can buy fewer of them with every dollar they have saved. This is called inflation, and it eats into investors’ returns.

Real rates of return are adjusted for inflation, so they account for changes in the purchasing power of a dollar over the life of an investment. Because inflation affects the cost of living, investors must consider the inflation-adjusted—or real—return of their investments. When inflation outpaces the nominal returns on an investment, investors experience negative real returns and actually lose purchasing power.

BRIEF HISTORY: TREASURY BILL RETURNS

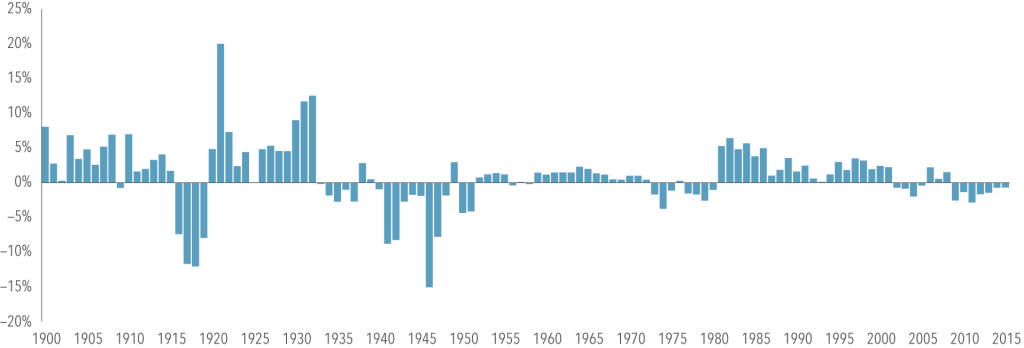
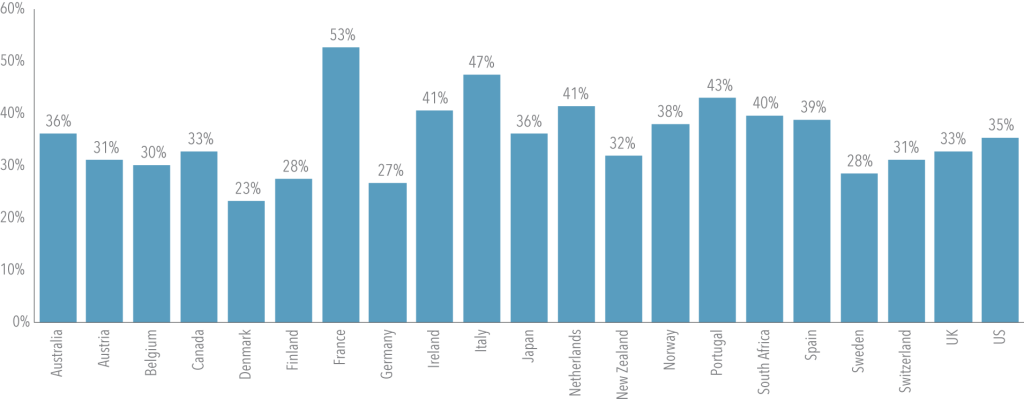
Exhibit 1 shows the annual real returns on one-month US Treasury bills. From 2009 to 2015, the annual real return was negative. This circumstance is not unprecedented. Since 1900, the US has had negative real returns in over a third of those years. And negative real returns on government bills are not exclusive to the US. All countries listed in Exhibit 2 have had negative real returns on their respective government bills in at least one out of every five years from 1900 to 2015.

Exhibit 1. Annual Real Returns of One-Month US Treasury Bills

Negative Interest Rates

Source: Dimson, Marsh, and Staunton (DMS); Morningstar.

Exhibit 2. Percent of Years with Negative Real Returns on Government Bills, 1900-2015

Negative Interest Rates

Source: Dimson, Marsh, and Staunton (DMS); Morningstar.

BOND INVESTORS MAY GET MORE THAN THE BILL RETURN

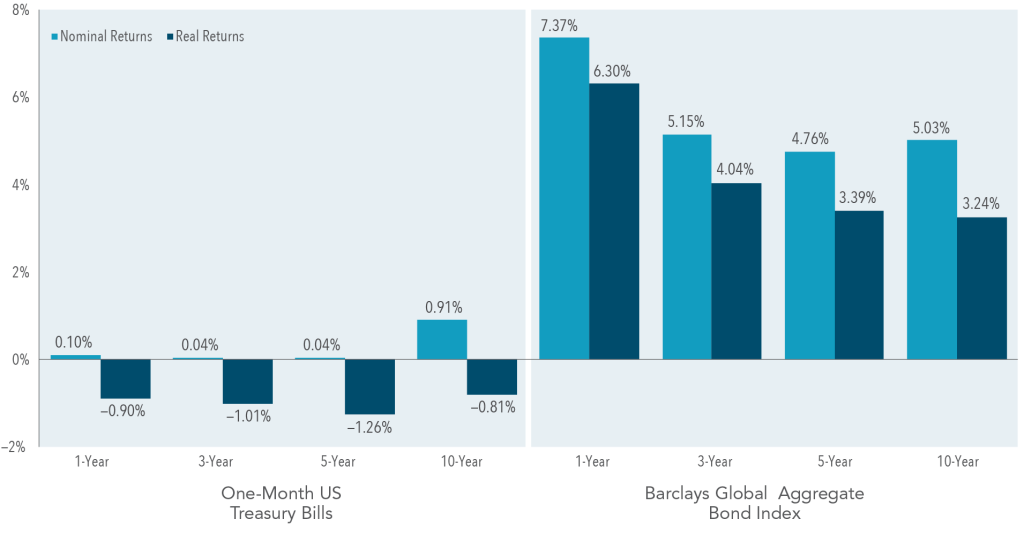
In the current low-yield environment, rolling over short-term bills may not seem appealing to investors keen on protecting their purchasing power. Exhibit 3 shows that the return of one-month US Treasury bills has not kept pace with inflation2 over the past 10 years. But even when the real return on bills is negative, a relatively common occurrence, bond investors may still achieve positive expected real returns by broadening their investment universe. The bond market is composed of thousands of global bonds with different characteristics. Many of those bonds allow investors to target global term and credit premiums, which in turn may provide positive real returns even in low interest rate environments. Exhibit 3 also shows that the Barclays Global Aggregate Bond Index has outpaced inflation while maintaining low real return volatility of 3.4% annualized over the past 10 years.

Exhibit 3. Trailing Annualized Returns

Negative Interest Rates

Past performance is not a guarantee of future results. Indices are not available for direct investment; therefore, their performance does not reflect the expenses associated with the management of an actual portfolio. Trailing returns are as of June 2016. The Barclays Global Aggregate Bond Index is hedged to USD. Real Return = [(1 + Nominal Return)/(1 + Inflation)] − 1. Sources: Barclays, Morningstar. Barclays indices copyright Barclays 2016.

Global diversification is often thought of as a tool for reducing risk. However, when it comes to fixed income, global portfolios can also play an important role in the pursuit of increased expected returns. Even if the expected real returns of bonds in one country are negative, another yield curve may provide positive expected real returns. The flexibility to pursue higher expected returns by investing in bonds around the world can be an important defense against low, and even negative, yields.

SUMMARY

The goal of many investors is to grow some (or all) of their savings in real terms. Even in a low or negative interest rates environment, there may be bond investments that can still achieve this goal. In particular, investors who target global term and credit premiums should be better positioned to pursue higher expected returns.

During our on-boarding process, there is extensive analysis of the current portfolio positions. We often ask new clients to explain the reasons they own certain mutual funds or other positions in their portfolios. The most common answer is “not sure, our financial advisor did it.” And this lack of attention is precisely why I do what I do. I believe education surrounding the “why” in a client’s portfolio is crucial to a positive investment experience. Owning just U.S. stocks or just U.S. bonds is doing yourself a disservice. There is a world of opportunity to invest in that can match your long-term financial goals and risk tolerance. We work with all types of wonderful people and if you want to experience a different way of investing, get in touch today.


1. Source: Bureau of Labor Statistics

2. Measured as changes in the Consumer Price Index (CPI), which is defined by the US Department of Labor, Bureau of Labor and Statistics.

3. Written by Dimensional Fund Advisors with edits by Coastal Wealth Advisors, LLC.
Presidential Elections and the Stock Market

Next month, we head to the polls to elect the next president of the United States. Unless you don’t watch the news or spend time on social media, you know how heated this presidential election cycle has become. While the outcome is unknown, one thing is for certain: there will be a steady stream of opinions from pundits and prognosticators about how the election will impact the stock market, and thus your investment and retirement portfolio. As we explain below, investors would be well‑served to avoid the temptation to make significant changes to a long‑term investment plan based upon these sorts of predictions.

SHORT-TERM TRADING AND PRESIDENTIAL ELECTIONS RESULTS

Trying to outguess the market is often a losing game. Current market prices offer an up-to-the-minute snapshot of the aggregate expectations of market participants. This includes expectations about the outcome and impact of presidential elections. While unanticipated future events—surprises relative to those expectations—may trigger price changes in the future, the nature of these surprises cannot be known by investors today. As a result, it is difficult, if not impossible, to systematically benefit from trying to identify mispriced securities. This suggests it is unlikely that investors can gain an edge by attempting to predict what will happen to the stock market after any presidential elections.

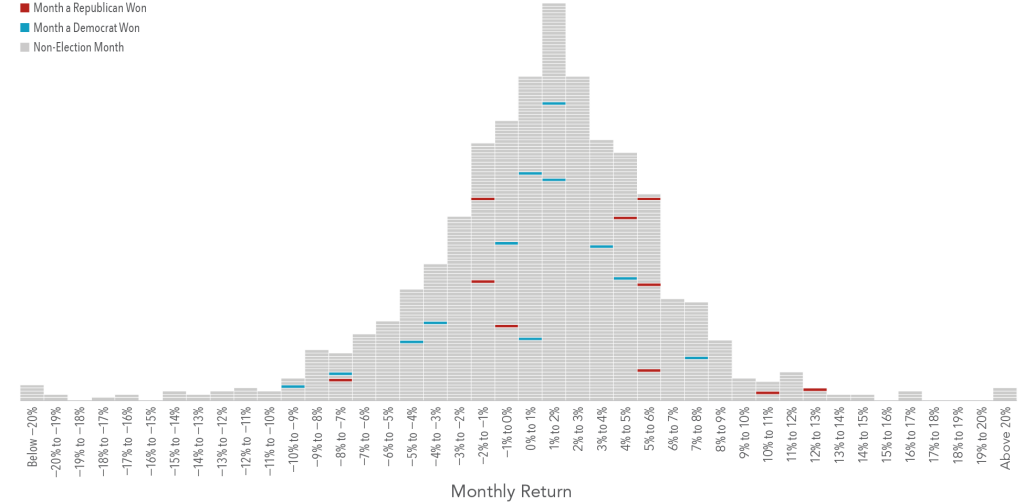
Exhibit 1 shows the frequency of monthly returns (expressed in 1% increments) for the S&P 500 Index from January 1926 to June 2016. Each horizontal dash represents one month, and each vertical bar shows the cumulative number of months for which returns were within a given 1% range (e.g., the tallest bar shows all months where returns were between 1% and 2%). The blue and red horizontal lines represent months during which presidential elections were held. Red corresponds with a resulting win for the Republican Party and blue with a win for the Democratic Party. This graphic illustrates that election month returns were well within the typical range of returns, regardless of which party won the presidential elections.

Exhibit 1: Presidential Elections and S&P 500 Returns, Histogram of Monthly Returns, January 1926 — June 2016

Presidential Elections

LONG-TERM INVESTING: BULLS & BEARS ≠ DONKEYS & ELEPHANTS

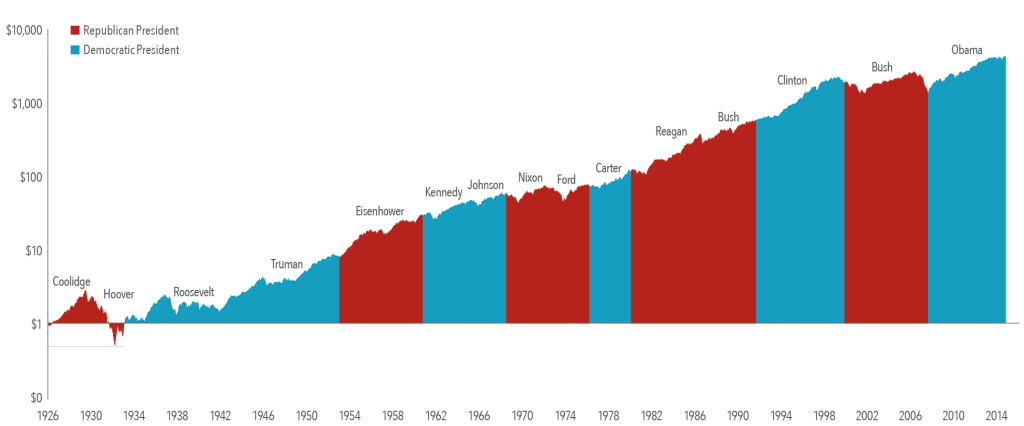
Predictions about presidential elections and the stock market often focus on which party or candidate will be “better for the market” over the long run. Exhibit 2 shows the growth of one dollar invested in the S&P 500 Index over nine decades and 15 presidencies (from Coolidge to Obama). This data does not suggest an obvious pattern of long-term stock market performance based upon which party holds the Oval Office. The key takeaway here is that over the long run, the market has provided substantial returns regardless of who controlled the executive branch.

Exhibit 2: Growth of a Dollar Invested in the S&P 500, January 1926–June 2016

Presidential Elections

Past performance is not a guarantee of future results. Presidential Elections. Indices are not available for direct investment; therefore, their performance does not reflect the expenses associated with the management of an actual portfolio. The S&P data is provided by Standard & Poor’s Index Services Group.
CONCLUSION

Equity markets can help investors grow their assets, but investing is a long-term endeavor. Trying to make investment decisions based upon the outcome of presidential elections is unlikely to result in reliable excess returns for investors. At best, any positive outcome based on such a strategy will likely be the result of random luck. At worst, it can lead to costly mistakes. Accordingly, there is a strong case for investors to rely on patience and portfolio structure, rather than trying to outguess the market, in order to pursue investment returns.

We perform a wide range of services for our clients outside of building, managing, monitoring, and rebalancing investment portfolios. One of the most important of these services, in our opinion, is the conversation we have surrounding behavioral finance, risk tolerance, and their impact on emotional decision making. As you can see by this post, we always turn to “the data” to help guide our advice. If you’re working with a financial advisor today who has positioned your portfolio to try to outguess the presidential elections, give us a call. We’re confident that our approach makes for a more positive investment experience.


1. Content written by Dimensional Fund Advisors, LP with edits by Coastal Wealth Advisors, LLC.
 

Positive News Articles

Positive News Articles

Where are all the positive news articles? Do you ever listen to the news and find yourself thinking that the world has gone to the dogs? The roll call of depressing headlines seems endless. But look beyond what the media calls news, and there also are a lot of things going right.

It’s true the world faces challenges in maintaining stable and well-functioning social, environmental, and economic systems. The legacy of the financial crisis is still with us, and concerns about climate change and sustainability are widespread.

Europe is grappling with a refugee crisis; China faces a difficult transition from an export and industrial-led economy to one driven by domestic demand; and the US is preoccupied with a sometimes rancorous election campaign.

But it’s also easy to overlook significant advances in raising the living standards of millions, increasing global cooperation on sustainability, and efforts to build greater transparency and trust in financial institutions.

Many of the 10 developments cited below don’t tend to make the front pages of daily newspapers in the form of positive news articles or the lead items in the TV news, but they’re worth keeping in mind on those occasions when you feel overwhelmed by all the grim headlines.

So here’s an alternative positive news articles bulletin:

  1. Over the last 25 years, 2 billion people globally have moved out of extreme poverty, according to the latest United Nations Human Development Report.1
  2. Over the same period, mortality rates among children under the age of 5 have fallen by 53%, from 91 deaths per 1000 to 43 deaths per 1000.
  3. In September 2015, all members of the UN set 17 sustainable development goals for 2030, including targets for eliminating poverty and hunger and lifting standards in health, education, water, energy, and infrastructure.
  4. Global trade has expanded as a proportion of GDP from 20% in 1995 to 30% by 2014, signaling greater global integration.2
  5. Global bank regulators recently announced that since the financial crisis they have implemented reforms to reduce leverage, address systemic risk, and build capital buffers into the banking system.3
  6. The world’s biggest economy, the US, has been recovering. Unemployment has halved in six years from 10% to 5%.4
  7. Global oil prices, while about 80% up from January’s 13-year lows, are still 50% below where they were two years ago. While bad news for the oil sector, lower prices also raise real incomes for consumers, increase profits outside energy, and decrease costs of production.
  8. While fossil fuels still play a major role in the economy, renewable energy sources—such as solar and wind— accounted for nearly 22% of global electricity generation in 2013 and are seen rising to at least 26% by 2020.5
  9. We live in an era of rapid innovation. One report estimates the digital economy now accounts for 22.5% of global economic output and projects digital technologies could generate $2 trillion of additional output by 2020.6
  10. The growing speed and scale of data are increasing global connectedness and transforming industries as new discoveries are made in such areas as engineering, medicine, food, energy, and sustainability.

No doubt many of these advances will lead to new business and investment opportunities. Of course, not all will succeed. But the important point is that science and innovation are evolving in ways that can help mankind. The world is far from perfect. The human race faces major challenges. But just as it is important to be realistic and aware of the downside of our condition, we must also recognize the major advances that we are making.

Just as there is reason for caution, there is always room for hope. And keeping these positive news articles and trends in mind can help when you feel overwhelmed by all the bad news. Working with an investment advisor and financial planner can help you keep a perspective on the positive news articles that have an impact on your portfolio and long-term financial plan. Looking at the daily barrage of negativity through traditional media outlets as well as Facebook and other social media platforms can seriously dampen your mood. A constant state of depressed emotions and feelings can have lasting negative effects on the decisions you make with your money. One of the core investment philosophies of Coastal Wealth Advisors is keeping emotions in check – thereby helping to prevent our clients from making poor decisions at the worst times. Let us be your fiduciary; let us help you towards a more meaningful investing and planning experience. Get in touch today to learn about our unique financial planning process.

Image credit: Nitin Dhumal

1.”Human Development Report 2015: Work for Human Development,” United Nations.
2.”International Trade Statistics 2015,” World Trade Organization.
3.”Finalising Post-Crisis Reforms: An Update,” Bank for International Settlements, November 2015.
4. Bureau of Labor Statistics, May 26, 2016.
5. “Renewable Energy Statistics,” International Energy Agency, March 2016.
6. “Digital Disruption: The Growth Multiplier,” Accenture and Oxford Economics, February 2016
7. Authored by Jim Parker of Dimensional Fund Advisors. Original article here.

Stock Market News

Stock Market News

Why don’t the media run more good stock market news? One view is bad news sells. If people preferred good news, the media would supply it. But stock markets don’t see news as necessarily good or bad, rather in terms of what is already built into prices.

One academic study appears to confirm the view that the apparent preponderance of bad stock market news is as much due to demand as to supply, with participants more likely to select negative content regardless of their stated preferences for upbeat stock market news.1

“This preference for negative and/or strategic information may be subconscious,” the authors conclude. “That is, we may find ourselves selecting negative and/or strategic stories even as we state that we would like other types of information.”

So an innate and unrecognized demand among consumers for bad stock market news tends to encourage attention-seeking commercial media to supply more of what the public appears to want, thus fueling a self-generating cycle.

Insofar as consumers of stock market news are investors, though, the danger can come when the emotions generated by bad stock market news prompt them to make changes to their portfolios, unaware that the stock market news is likely already built into market prices.

This is especially the case when the notions of “good or bad” are turned upside down on financial markets. For example, stocks and Treasuries rallied and the US dollar weakened in early October after a weaker-than-expected US jobs report. Some observers said the “bad news” on jobs was “good news” for interest rates.2

Conversely, a month later, stocks ended mixed, bonds weakened, and the US dollar rallied after a stronger-than-expected payrolls number. While an improving job market is good news, it was also seen by some as cementing the case for the Federal Reserve to begin raising interest rates. In both cases, the important thing for markets was not whether the report was good or bad but how it compared to the expectations already reflected in prices. As news is always breaking somewhere, expectations are always changing.

For the individual investor seeking to make portfolio decisions based on stock market news, this presents a real challenge. First, to profit from news you need to be ahead of the market. Second, you have to anticipate how the market will react. This does not sound like a particularly reliable investment strategy.

Luckily, there is another less scattergun approach. It involves working with the market and accepting that stock market news is quickly built into prices. Those prices, which are forever changing, reflect the collective views of all market participants and reveal information about expected returns. So instead of trying to second-guess the market by predicting news, investors can use the information already reflected in prices to build diverse portfolios based on the dimensions that drive higher expected returns.

As citizens and media consumers we are all entitled to our individual opinions on whether stock market news is good or bad. As investors, though, we can trust market prices to assimilate news instantaneously and work from there.

In a sense, the work and the worrying are already done for us. This leaves us to work alongside a Johns Island Investment Advisor to build globally diverse portfolios designed around our own circumstances, risk appetites, and long-term goals.

There’s no need to respond to stock market news, good or bad.


1. Marc Trussler and Stuart Soroka, “Consumer Demand for Cynical and Negative News Frames,” International Journal of Press/Politics (2014).
2. Mark Hulbert, “How Bad News on Wall Street Can Be Good News,” WSJ MarketWatch (October 5, 2015).
3. Author: Jim Parker, Vice President, Dimensional Fund Advisors with some edits by Coastal Wealth Advisors, LLC. Original article here.