2016: A Year in Review

Every year brings its share of surprises. But how many of us could have imagined that 2016 would see the Chicago Cubs win the World Series, Bob Dylan receive the Nobel Prize in Literature, Donald Trump elected president, and the Dow Jones Industrial Average close out the year a whisker away from 20,000?

The answer is very few—a lesson that investors would be wise to remember.

At year-end 2015, financial optimists seemed in short supply. Not one of the nine investment strategists participating in the January 2016 Barron’s Roundtable expected an above-average year for stocks. Six expected US market returns to be flat or negative, while the remaining three predicted returns in single digits at best. Prospects for global markets appeared no better, according to this group, and two panelists were sufficiently gloomy to recommend shorting exchange-traded emerging markets index funds.1

Results in early January 2016 appeared to confirm the pessimists’ viewpoint as markets fell sharply around the world; the S&P 500 Index fell 8% over the first 10 trading sessions alone. The 8.25% loss for the Dow Jones Industrial Average over this period was the biggest such drop throughout the 120-year history of that index.2 For fans of the so-called January Indicator, the outlook was grim.

Then things seemingly got worse.

Oil prices fell sharply. Worries about an economic debacle in China re-entered the news cycle. Stock markets in France, Japan, and the UK registered losses of more than 20% from their previous peaks, one customary measure of a bear market.3 Plunging share prices for leading banks had many observers worried that another financial crisis was brewing. As US stock prices fell for a fifth consecutive day on February 11, shares of the five largest US banks slumped nearly 5%, down 23% for 2016.

The Wall Street Journal reported the following day that “bank stocks led an intensifying rout in financial markets.”4 A USA Today journalist observed that “The persistent pounding global stock markets are taking seems to be taking on a more sinister tone and more dangerous phase, with emotions and fear taking on a bigger role in the rout, investors questioning the ability of the world’s central bankers to calm the market’s frayed nerves, and a volatile environment in which selling begets more selling.”5

February 11 marked the low for the year for the US stock market. While prices eventually recovered, as late as June 28 the S&P 500 was still showing a loss for the year. Meanwhile, a number of well-regarded professional investors argued that the next downturn was fast approaching. One prominent activist in May predicted a “day of reckoning” for the US stock market, while another reportedly urged his fellow hedge fund managers at a conference to “get out of the stock market.” A third disclosed in August a doubling of his bearish bet on the S&P 500.6

Throughout the year, some observers fretted over the pace of the economic recovery. The New York Times reported in July that “Weighed down by anemic business spending, overstocked factories and warehouses, and a surprisingly weak housing sector, the American economy barely improved this spring after its usual winter doldrums.”7

Despite all of this noise, the S&P 500 returned 11.9% for the year and international stocks8 returned 4.4% for US dollar investors (6.9% in local currency9), helping to illustrate just how difficult it is to outguess market prices. Once again, a simple strategy of embracing sensible asset allocation and broad diversification was likely less frustrating than fretting over portfolio changes in response to news events.

We believe it’s as important today as it was 10 years ago to base your portfolio allocation structure on two broad concepts: 1st, your risk tolerance, and 2nd, what financial goals your portfolio will be used for. We help our clients develop their financial goals and then build and monitor a portfolio that marries these goals with their appetite for risk. And we’d love to help you too. Get in touch today.


1. Lauren Rublin, “Peering into the Future,” Barron’s, January, 25, 2016.
2. www.djaverages.com, accessed January 6, 2017.
3. Michael Mackenzie, Robin Wigglesworth, and Leo Lewis, “Stock Exchanges across the World Plunge into Bear Market Territory,” Financial Times, January 21, 2016.
4. Tommy Stubbington and Margot Patrick, “Banks Drop as Global Rout Deepens,” Wall Street Journal, February 12, 2016.
5. Adam Shell, “Market Tumult Charts New Waters,” USA Today, February 12, 2016.
6. Dan McCrum and Nicole Bullock, “Growling Bears Provide Soundtrack for Investors,” Financial Times, May 21, 2016.
7. Nelson D. Schwartz, “US Economy Stays Stuck in Low Gear,” New York Times, July 29, 2016.
8. Source: MSCI. International stocks represented by the MSCI All Country World ex US IMI (net div.).
9. Local currency return calculation represents the price appreciation or depreciation of index constituents and does not account for the performance of currencies relative to a base currency such as the US Dollar. Local currency return is theoretical and cannot be replicated in the real world.
10. Article written by Weston Wellington with edits by Coastal Wealth Advisors, LLC.

Negative Interest Rates

Nominal interest rates are currently below zero in many countries, including Germany, Denmark, Switzerland, Sweden, and Japan. With new acronyms like ZIRP (Zero Interest Rate Policy) and NIRP (Negative Interest Rates Policy), these levels have turned the common belief that zero is the lower bound for such rates on its head. While negative interest rates are a relatively new phenomenon, periods of widespread negative real returns across countries have been quite common.

WHAT ARE AND WHY CARE ABOUT REAL RATES OF RETURN?

In 1970, a loaf of bread cost 25 cents. A gallon of gas cost 36 cents. Today, an average loaf of bread and a gallon of gas each cost around two dollars.When the prices of goods and services increase, consumers can buy fewer of them with every dollar they have saved. This is called inflation, and it eats into investors’ returns.

Real rates of return are adjusted for inflation, so they account for changes in the purchasing power of a dollar over the life of an investment. Because inflation affects the cost of living, investors must consider the inflation-adjusted—or real—return of their investments. When inflation outpaces the nominal returns on an investment, investors experience negative real returns and actually lose purchasing power.

BRIEF HISTORY: TREASURY BILL RETURNS

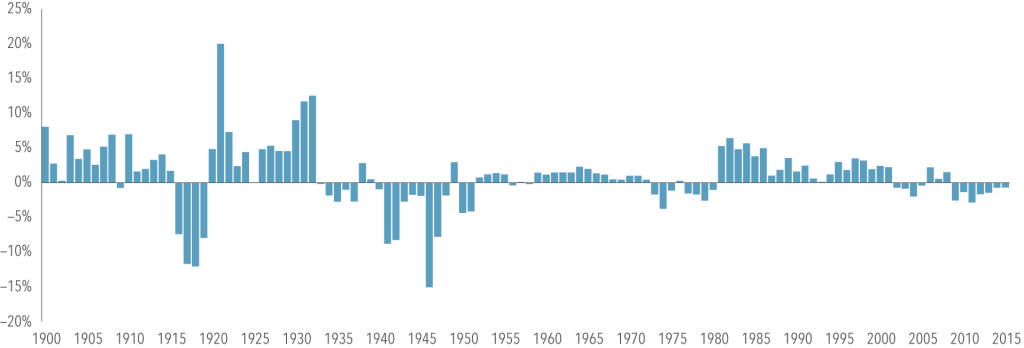
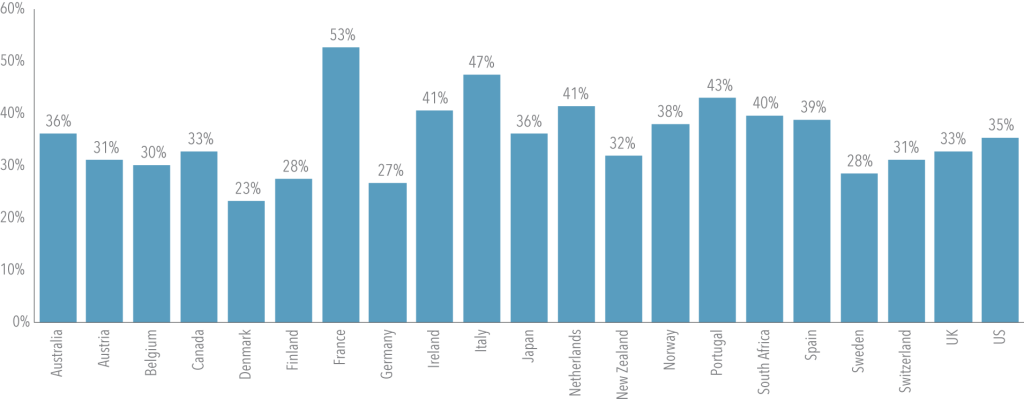
Exhibit 1 shows the annual real returns on one-month US Treasury bills. From 2009 to 2015, the annual real return was negative. This circumstance is not unprecedented. Since 1900, the US has had negative real returns in over a third of those years. And negative real returns on government bills are not exclusive to the US. All countries listed in Exhibit 2 have had negative real returns on their respective government bills in at least one out of every five years from 1900 to 2015.

Exhibit 1. Annual Real Returns of One-Month US Treasury Bills

Negative Interest Rates

Source: Dimson, Marsh, and Staunton (DMS); Morningstar.

Exhibit 2. Percent of Years with Negative Real Returns on Government Bills, 1900-2015

Negative Interest Rates

Source: Dimson, Marsh, and Staunton (DMS); Morningstar.

BOND INVESTORS MAY GET MORE THAN THE BILL RETURN

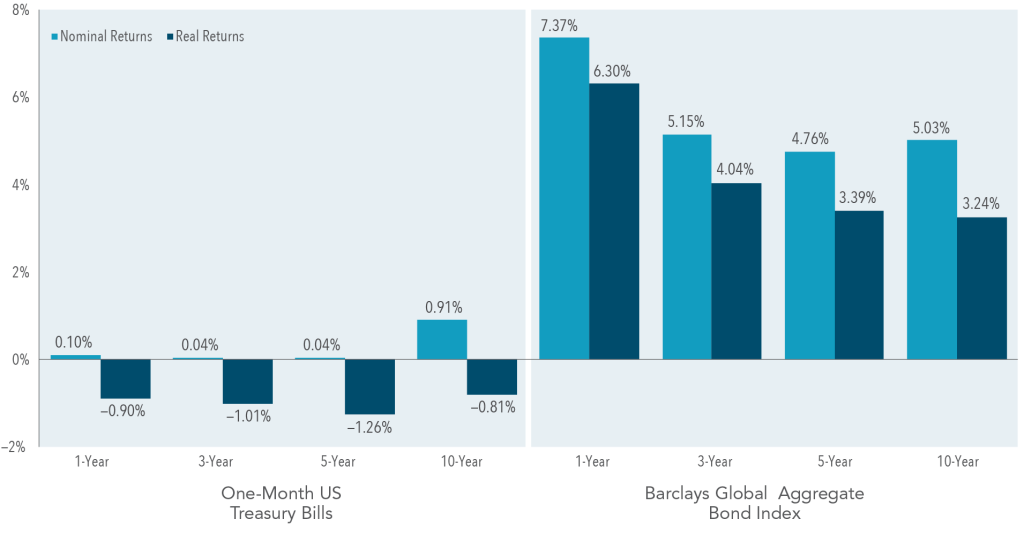
In the current low-yield environment, rolling over short-term bills may not seem appealing to investors keen on protecting their purchasing power. Exhibit 3 shows that the return of one-month US Treasury bills has not kept pace with inflation2 over the past 10 years. But even when the real return on bills is negative, a relatively common occurrence, bond investors may still achieve positive expected real returns by broadening their investment universe. The bond market is composed of thousands of global bonds with different characteristics. Many of those bonds allow investors to target global term and credit premiums, which in turn may provide positive real returns even in low interest rate environments. Exhibit 3 also shows that the Barclays Global Aggregate Bond Index has outpaced inflation while maintaining low real return volatility of 3.4% annualized over the past 10 years.

Exhibit 3. Trailing Annualized Returns

Negative Interest Rates

Past performance is not a guarantee of future results. Indices are not available for direct investment; therefore, their performance does not reflect the expenses associated with the management of an actual portfolio. Trailing returns are as of June 2016. The Barclays Global Aggregate Bond Index is hedged to USD. Real Return = [(1 + Nominal Return)/(1 + Inflation)] − 1. Sources: Barclays, Morningstar. Barclays indices copyright Barclays 2016.

Global diversification is often thought of as a tool for reducing risk. However, when it comes to fixed income, global portfolios can also play an important role in the pursuit of increased expected returns. Even if the expected real returns of bonds in one country are negative, another yield curve may provide positive expected real returns. The flexibility to pursue higher expected returns by investing in bonds around the world can be an important defense against low, and even negative, yields.

SUMMARY

The goal of many investors is to grow some (or all) of their savings in real terms. Even in a low or negative interest rates environment, there may be bond investments that can still achieve this goal. In particular, investors who target global term and credit premiums should be better positioned to pursue higher expected returns.

During our on-boarding process, there is extensive analysis of the current portfolio positions. We often ask new clients to explain the reasons they own certain mutual funds or other positions in their portfolios. The most common answer is “not sure, our financial advisor did it.” And this lack of attention is precisely why I do what I do. I believe education surrounding the “why” in a client’s portfolio is crucial to a positive investment experience. Owning just U.S. stocks or just U.S. bonds is doing yourself a disservice. There is a world of opportunity to invest in that can match your long-term financial goals and risk tolerance. We work with all types of wonderful people and if you want to experience a different way of investing, get in touch today.


1. Source: Bureau of Labor Statistics

2. Measured as changes in the Consumer Price Index (CPI), which is defined by the US Department of Labor, Bureau of Labor and Statistics.

3. Written by Dimensional Fund Advisors with edits by Coastal Wealth Advisors, LLC.
Presidential Elections and the Stock Market

Next month, we head to the polls to elect the next president of the United States. Unless you don’t watch the news or spend time on social media, you know how heated this presidential election cycle has become. While the outcome is unknown, one thing is for certain: there will be a steady stream of opinions from pundits and prognosticators about how the election will impact the stock market, and thus your investment and retirement portfolio. As we explain below, investors would be well‑served to avoid the temptation to make significant changes to a long‑term investment plan based upon these sorts of predictions.

SHORT-TERM TRADING AND PRESIDENTIAL ELECTIONS RESULTS

Trying to outguess the market is often a losing game. Current market prices offer an up-to-the-minute snapshot of the aggregate expectations of market participants. This includes expectations about the outcome and impact of presidential elections. While unanticipated future events—surprises relative to those expectations—may trigger price changes in the future, the nature of these surprises cannot be known by investors today. As a result, it is difficult, if not impossible, to systematically benefit from trying to identify mispriced securities. This suggests it is unlikely that investors can gain an edge by attempting to predict what will happen to the stock market after any presidential elections.

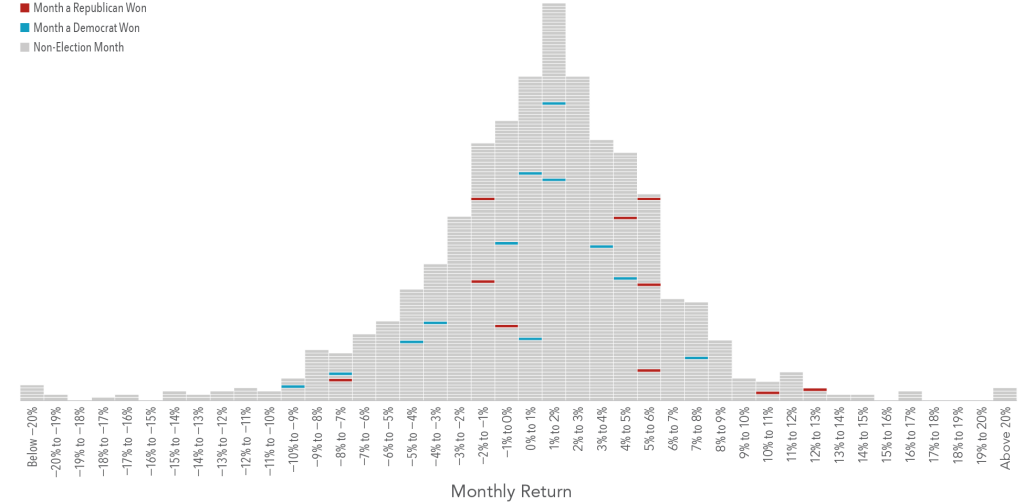
Exhibit 1 shows the frequency of monthly returns (expressed in 1% increments) for the S&P 500 Index from January 1926 to June 2016. Each horizontal dash represents one month, and each vertical bar shows the cumulative number of months for which returns were within a given 1% range (e.g., the tallest bar shows all months where returns were between 1% and 2%). The blue and red horizontal lines represent months during which presidential elections were held. Red corresponds with a resulting win for the Republican Party and blue with a win for the Democratic Party. This graphic illustrates that election month returns were well within the typical range of returns, regardless of which party won the presidential elections.

Exhibit 1: Presidential Elections and S&P 500 Returns, Histogram of Monthly Returns, January 1926 — June 2016

Presidential Elections

LONG-TERM INVESTING: BULLS & BEARS ≠ DONKEYS & ELEPHANTS

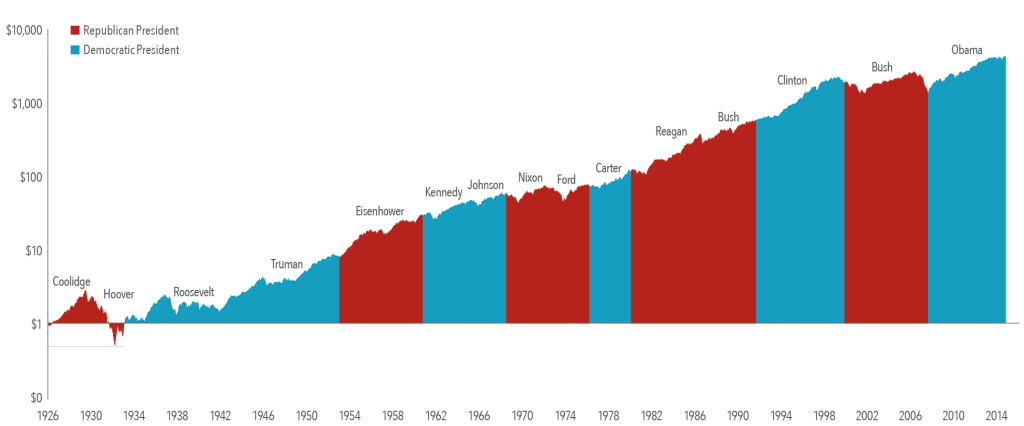
Predictions about presidential elections and the stock market often focus on which party or candidate will be “better for the market” over the long run. Exhibit 2 shows the growth of one dollar invested in the S&P 500 Index over nine decades and 15 presidencies (from Coolidge to Obama). This data does not suggest an obvious pattern of long-term stock market performance based upon which party holds the Oval Office. The key takeaway here is that over the long run, the market has provided substantial returns regardless of who controlled the executive branch.

Exhibit 2: Growth of a Dollar Invested in the S&P 500, January 1926–June 2016

Presidential Elections

Past performance is not a guarantee of future results. Presidential Elections. Indices are not available for direct investment; therefore, their performance does not reflect the expenses associated with the management of an actual portfolio. The S&P data is provided by Standard & Poor’s Index Services Group.
CONCLUSION

Equity markets can help investors grow their assets, but investing is a long-term endeavor. Trying to make investment decisions based upon the outcome of presidential elections is unlikely to result in reliable excess returns for investors. At best, any positive outcome based on such a strategy will likely be the result of random luck. At worst, it can lead to costly mistakes. Accordingly, there is a strong case for investors to rely on patience and portfolio structure, rather than trying to outguess the market, in order to pursue investment returns.

We perform a wide range of services for our clients outside of building, managing, monitoring, and rebalancing investment portfolios. One of the most important of these services, in our opinion, is the conversation we have surrounding behavioral finance, risk tolerance, and their impact on emotional decision making. As you can see by this post, we always turn to “the data” to help guide our advice. If you’re working with a financial advisor today who has positioned your portfolio to try to outguess the presidential elections, give us a call. We’re confident that our approach makes for a more positive investment experience.


1. Content written by Dimensional Fund Advisors, LP with edits by Coastal Wealth Advisors, LLC.