Nominal interest rates are currently below zero in many countries, including Germany, Denmark, Switzerland, Sweden, and Japan. With new acronyms like ZIRP (Zero Interest Rate Policy) and NIRP (Negative Interest Rates Policy), these levels have turned the common belief that zero is the lower bound for such rates on its head. While negative interest rates are a relatively new phenomenon, periods of widespread negative real returns across countries have been quite common.
WHAT ARE AND WHY CARE ABOUT REAL RATES OF RETURN?
In 1970, a loaf of bread cost 25 cents. A gallon of gas cost 36 cents. Today, an average loaf of bread and a gallon of gas each cost around two dollars.1 When the prices of goods and services increase, consumers can buy fewer of them with every dollar they have saved. This is called inflation, and it eats into investors’ returns.
Real rates of return are adjusted for inflation, so they account for changes in the purchasing power of a dollar over the life of an investment. Because inflation affects the cost of living, investors must consider the inflation-adjusted—or real—return of their investments. When inflation outpaces the nominal returns on an investment, investors experience negative real returns and actually lose purchasing power.
BRIEF HISTORY: TREASURY BILL RETURNS
Exhibit 1 shows the annual real returns on one-month US Treasury bills. From 2009 to 2015, the annual real return was negative. This circumstance is not unprecedented. Since 1900, the US has had negative real returns in over a third of those years. And negative real returns on government bills are not exclusive to the US. All countries listed in Exhibit 2 have had negative real returns on their respective government bills in at least one out of every five years from 1900 to 2015.
Exhibit 1. Annual Real Returns of One-Month US Treasury Bills
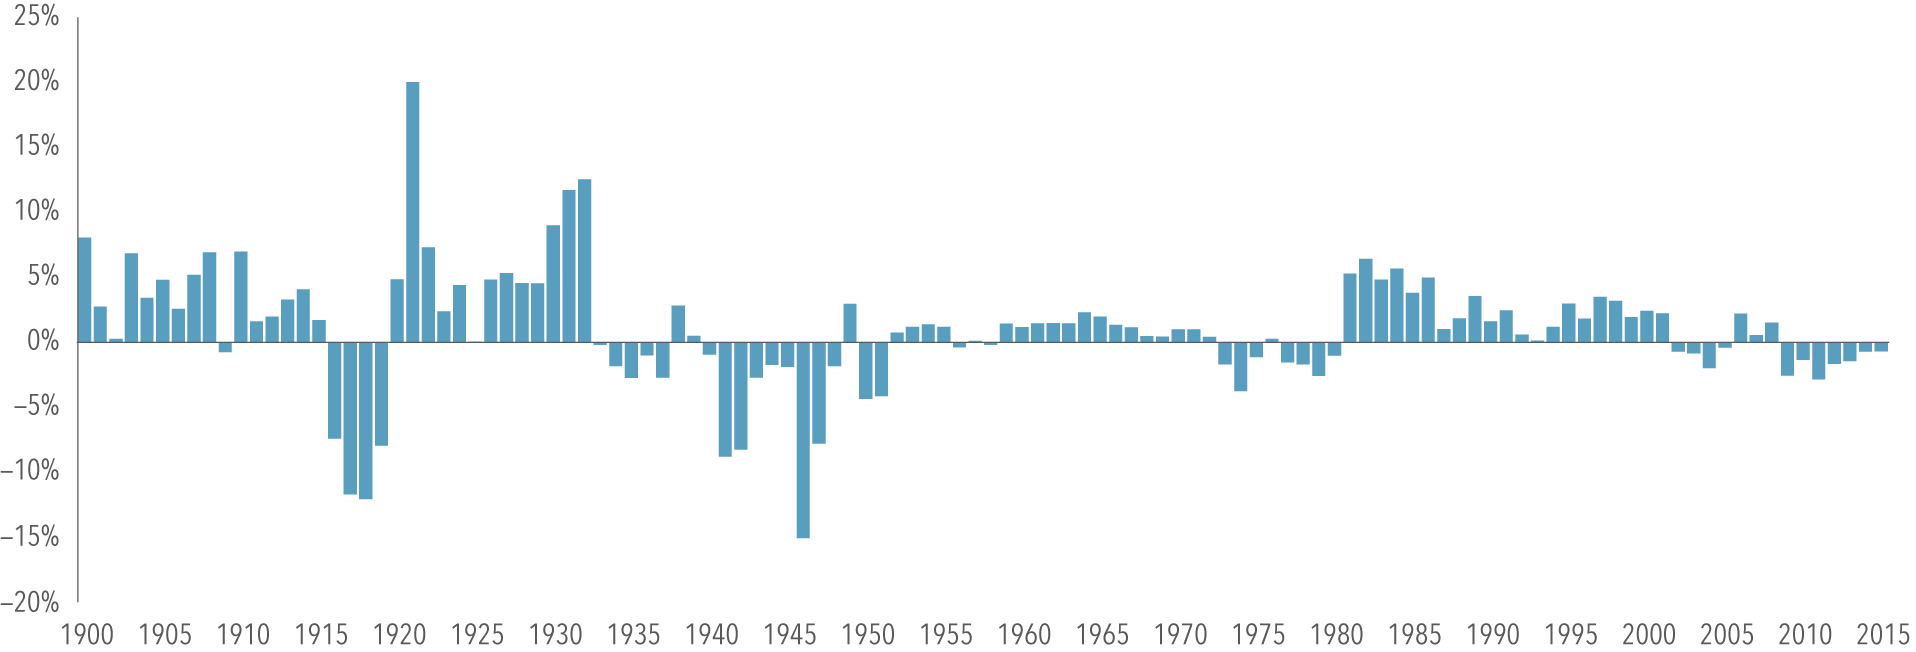
Source: Dimson, Marsh, and Staunton (DMS); Morningstar.
Exhibit 2. Percent of Years with Negative Real Returns on Government Bills, 1900-2015
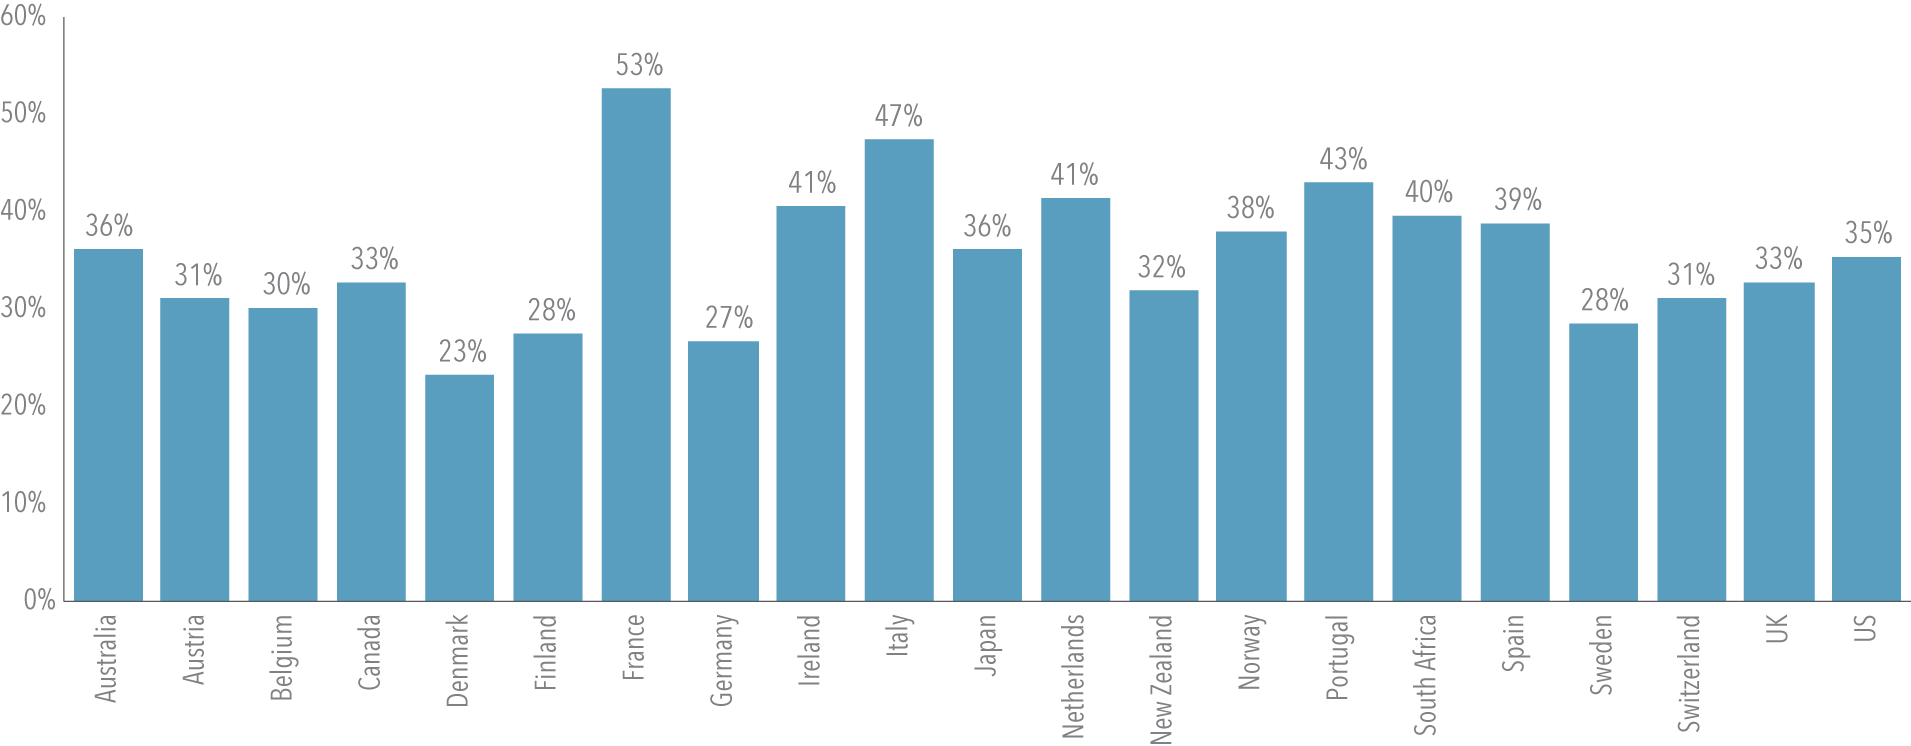
Source: Dimson, Marsh, and Staunton (DMS); Morningstar.
BOND INVESTORS MAY GET MORE THAN THE BILL RETURN
In the current low-yield environment, rolling over short-term bills may not seem appealing to investors keen on protecting their purchasing power. Exhibit 3 shows that the return of one-month US Treasury bills has not kept pace with inflation2 over the past 10 years. But even when the real return on bills is negative, a relatively common occurrence, bond investors may still achieve positive expected real returns by broadening their investment universe. The bond market is composed of thousands of global bonds with different characteristics. Many of those bonds allow investors to target global term and credit premiums, which in turn may provide positive real returns even in low interest rate environments. Exhibit 3 also shows that the Barclays Global Aggregate Bond Index has outpaced inflation while maintaining low real return volatility of 3.4% annualized over the past 10 years.
Exhibit 3. Trailing Annualized Returns
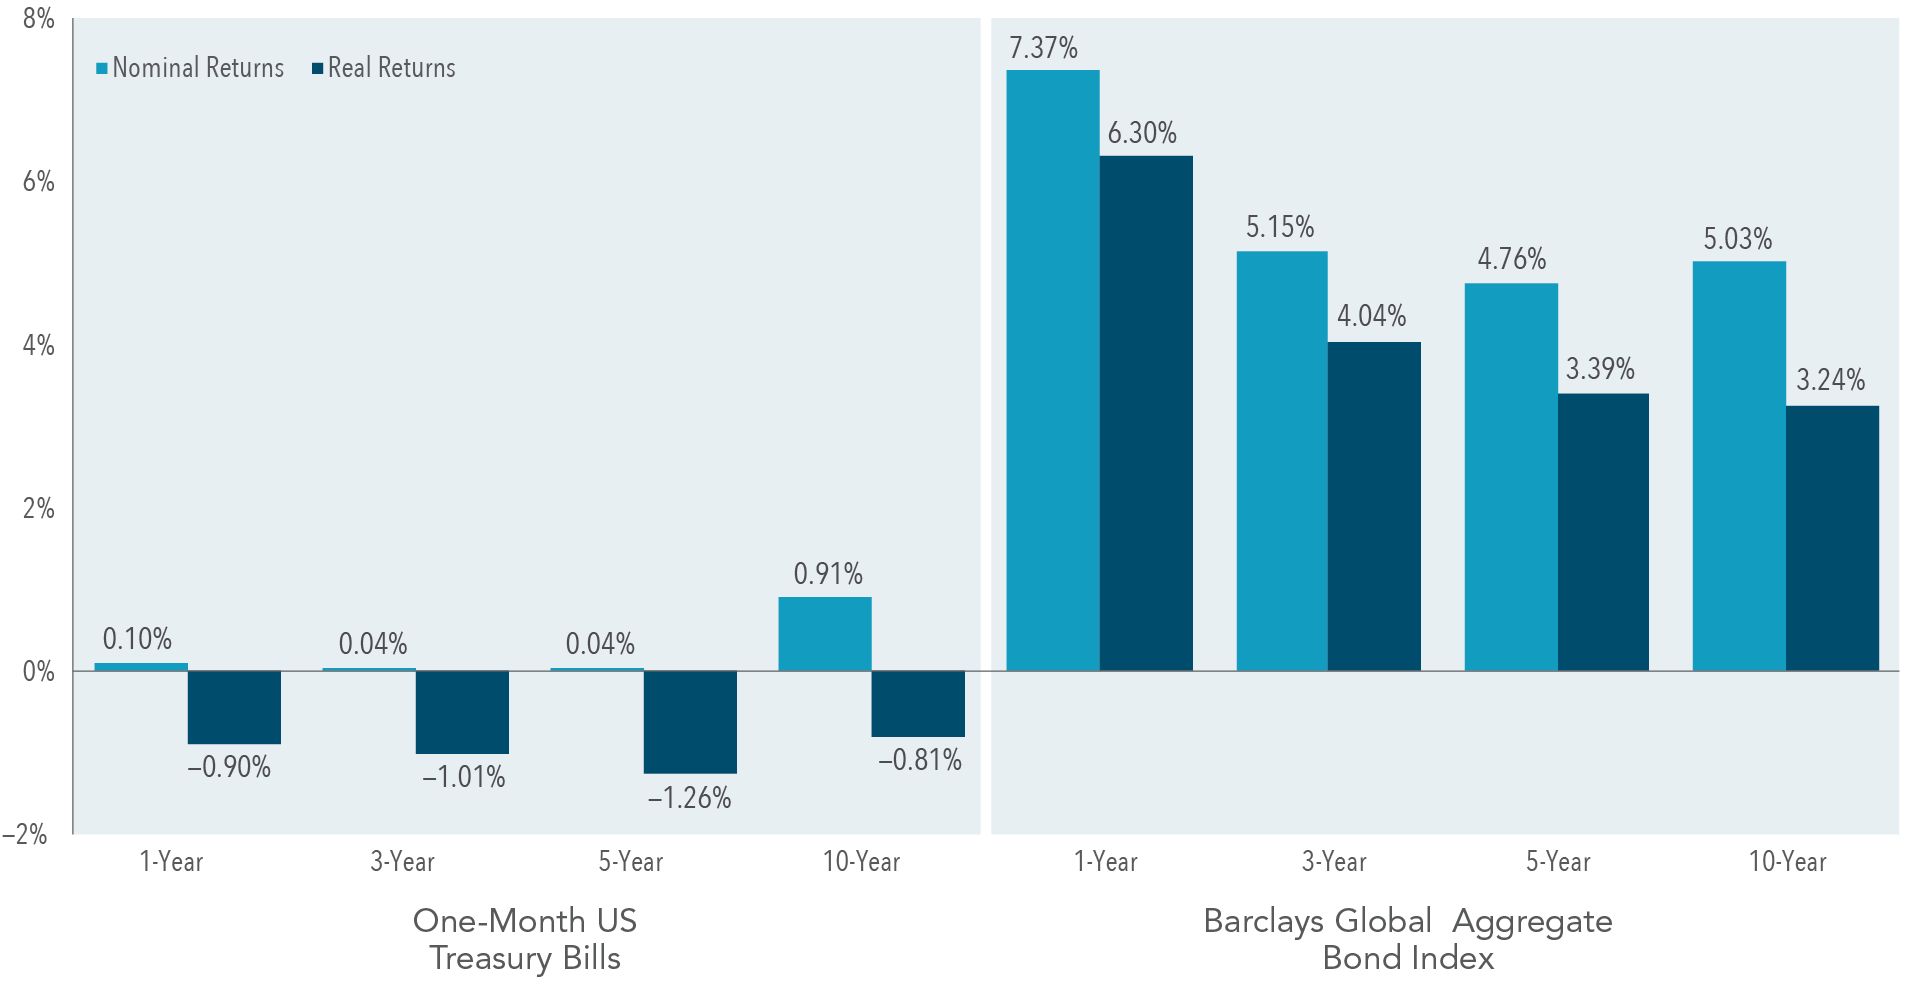
Past performance is not a guarantee of future results. Indices are not available for direct investment; therefore, their performance does not reflect the expenses associated with the management of an actual portfolio. Trailing returns are as of June 2016. The Barclays Global Aggregate Bond Index is hedged to USD. Real Return = [(1 + Nominal Return)/(1 + Inflation)] − 1. Sources: Barclays, Morningstar. Barclays indices copyright Barclays 2016.
Global diversification is often thought of as a tool for reducing risk. However, when it comes to fixed income, global portfolios can also play an important role in the pursuit of increased expected returns. Even if the expected real returns of bonds in one country are negative, another yield curve may provide positive expected real returns. The flexibility to pursue higher expected returns by investing in bonds around the world can be an important defense against low, and even negative, yields.
SUMMARY
The goal of many investors is to grow some (or all) of their savings in real terms. Even in a low or negative interest rates environment, there may be bond investments that can still achieve this goal. In particular, investors who target global term and credit premiums should be better positioned to pursue higher expected returns.
During our on-boarding process, there is extensive analysis of the current portfolio positions. We often ask new clients to explain the reasons they own certain mutual funds or other positions in their portfolios. The most common answer is “not sure, our financial advisor did it.” And this lack of attention is precisely why I do what I do. I believe education surrounding the “why” in a client’s portfolio is crucial to a positive investment experience. Owning just U.S. stocks or just U.S. bonds is doing yourself a disservice. There is a world of opportunity to invest in that can match your long-term financial goals and risk tolerance. We work with all types of wonderful people and if you want to experience a different way of investing, get in touch today.
1. Source: Bureau of Labor Statistics
2. Measured as changes in the Consumer Price Index (CPI), which is defined by the US Department of Labor, Bureau of Labor and Statistics.
3. Written by Dimensional Fund Advisors with edits by Coastal Wealth Advisors, LLC.